See it for yourself
Real history screens from a real boat — not mockups.
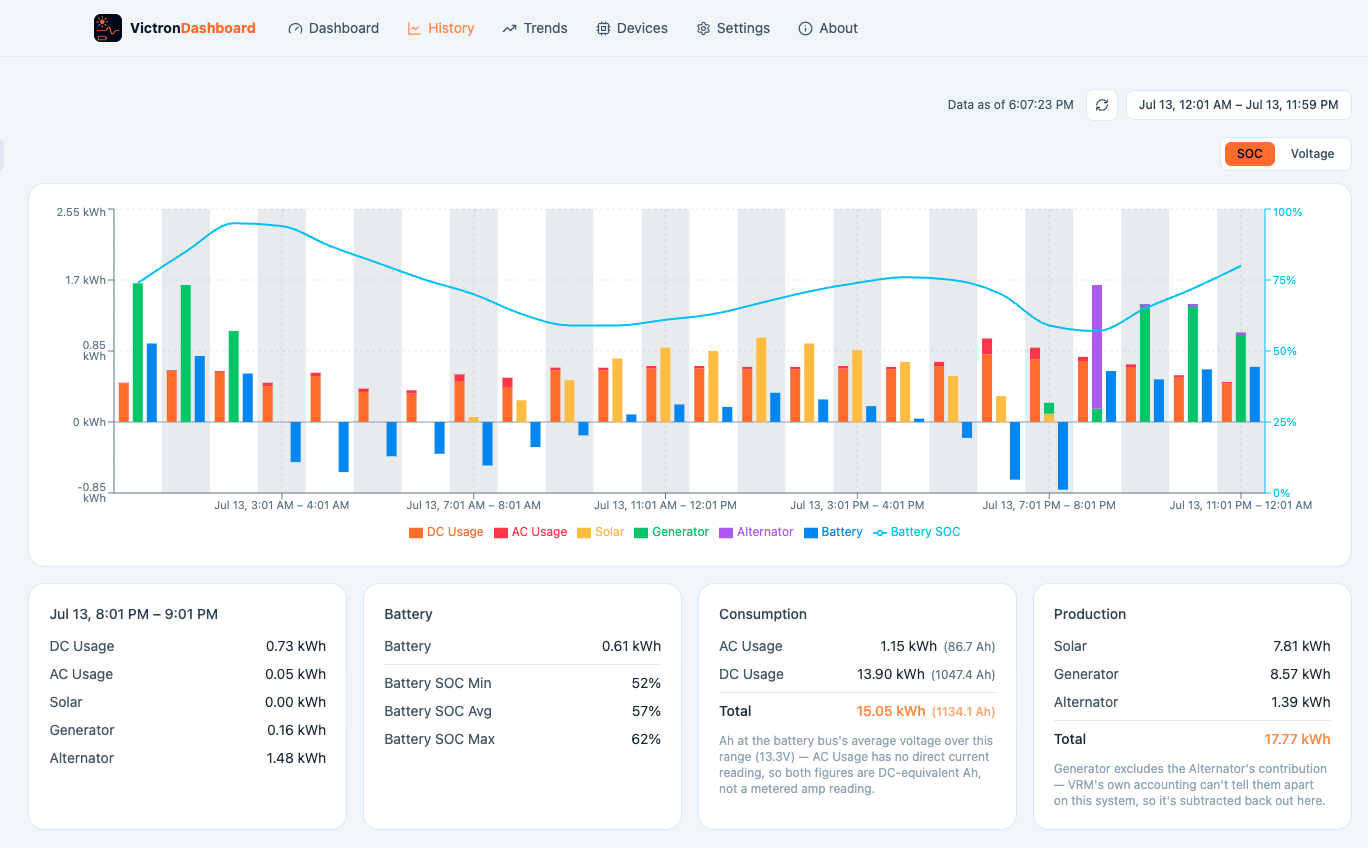
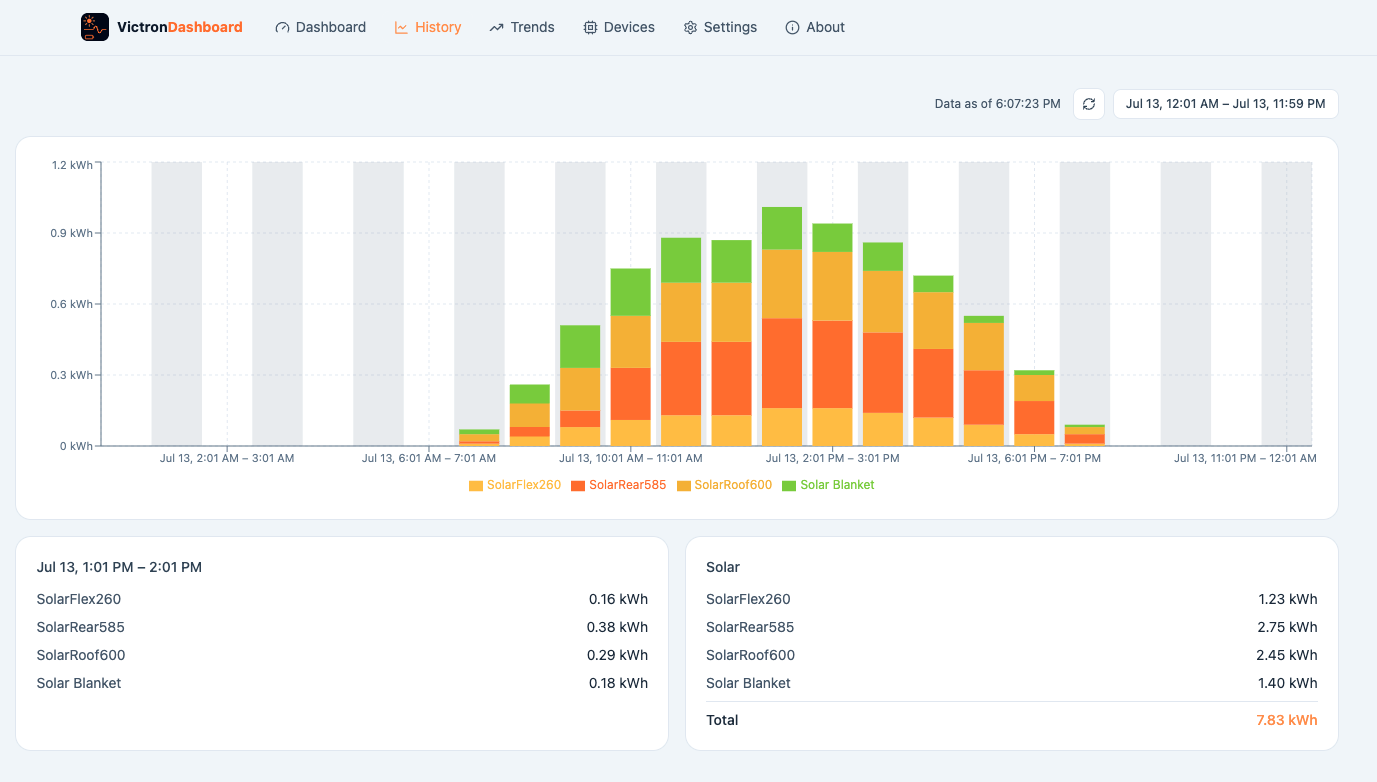
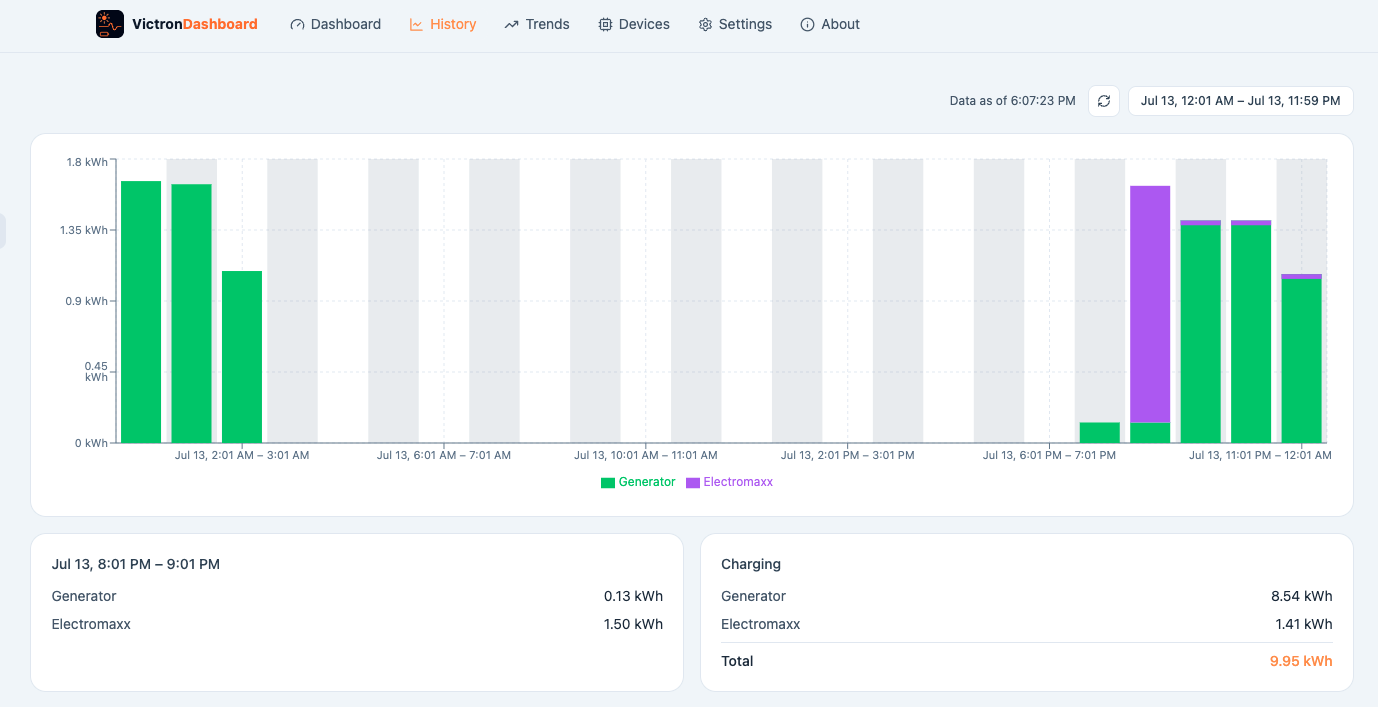
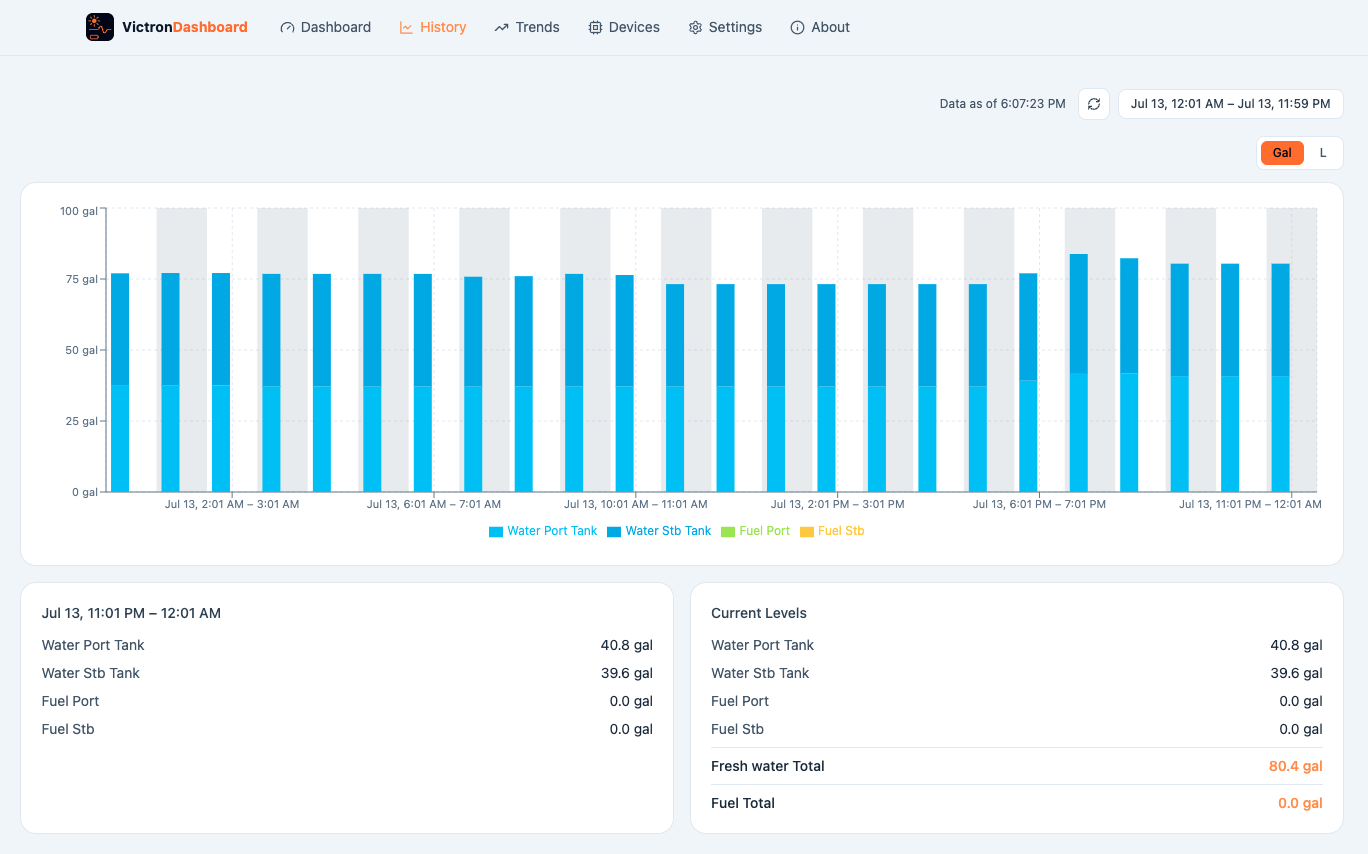
VictronDashboard is an installable app that reads directly from your own Victron VRM Portal API and lays the same data out in a more readable, more useful way — DC-only consumption history, tank levels in real units instead of just percent, solar potential measured against what you actually harvested, and a dashboard you can rearrange to match how you actually use your system.
Someone asked me that on Facebook. Here's the honest answer:
My biggest "want" was the ability to track DC consumption. My system is about six years old and I don't have a VE.Direct connection to my batteries. VRM doesn't show that in its main graph, and the widgets are pretty thin on info too. I'm on a boat — DC powers most of what I have, even my A/C unit.
If any of that sounds familiar — an older system, a battery bank VRM can't fully see into, or just more DC load than VRM's AC-focused screens were ever built for — this app exists because of exactly that gap.
Same VRM data you already have access to — just organized around the questions you actually ask about your system.
Pulls real weather data for your exact location and compares it against what your panels actually produced — so you can tell a cloudy day from an underperforming panel.
VRM's stock screens focus on AC. If most of your load is 12V/24V DC, this is the history graph you've been missing.
Tank levels in gallons or liters, AC loads in amps as well as watts — the numbers you'd actually write down, not just a gauge.
VRM only keeps detailed logs for about six months. This app quietly banks your history locally in the background, so your data keeps growing the longer you use it.
Drag tiles into the order that matches your system, hide the ones you don't need — it's your layout, not a fixed template.
Whether or not your battery bank talks directly to Victron (DVCC), the numbers are corrected automatically so generator and alternator figures come out right either way.
Real history screens from a real boat — not mockups.
Just your name and email — nothing else is stored on our server.
Download and add it to your desktop like any other PWA. It runs entirely in your browser.
Generate a personal access token in your own VRM account. It's stored only in your browser, never in a database — requests are relayed through our server to reach Victron's API, but your token is never logged or saved.
| Platform | Install as app | Notes |
|---|---|---|
| Chrome / Edge (Mac, Windows, Linux) | Yes | Best-supported combination — full install-to-desktop support. |
| Safari (macOS) | Yes | Supported, but Safari clears local app data after ~7 days without a visit — re-enter your VRM token if that happens. |
| Firefox (desktop) | Limited | Works as a regular tab; desktop "install" support is not available. |